Graphical User Interface
In case you do not want to work from the command line, the package provides a GUI based on dash (https://dash.plot.ly) to work with.
The different components of the GUI and how to use them shall be introduced.
For those seeking an in-depth look at the system we also provide a quick insight into the nqontrol.gui module, see the dev docs.
Starting the GUI
The GUI runs with gunicorn (https://gunicorn.org/), which is included in the requirements.
With the installed package
If you have installed the nqontrol package, you can start the GUI by executing the command
nqontrol
(Ensure to have the corresponding bin directory in your PATH. For a user installation on unix it is located at ~/.local/bin.)
After starting the server you can see the GUI in your browser on the default address http://127.0.0.1:8000/.
Other ways
Generally, gunicorn needs an entry point, in this case we’re using gunirun.py. You can start this using
python3 gunirun.py
when in the appropriate directory.
Please note that gunicorn does not enter through a main method, instead one has to provide a server instance. For that reason gunirun.py executes a subprocess. Luckily, gunicorn works with Flask, which Dash is based on, and one can simply pass the dash instance to gunicorn. The gunicorn-server can also be run manually, using
gunicorn -c guniconfig.py.ini run:server
if you are starting it from src/nqontrol. -c guniconfig.py.ini passes the configuration file, and run:server references the run.py module which assigns the dash instance to server. For more information, please read the extensive documentation on https://gunicorn.org/#docs.
Please note that gunicorn as of this time does not work on windows. A separate entry point for nqontrol is currently in the works.
How it looks
After starting the server you will see something like this, depending on how you defined your environment variables. The ADwin device we worked with comes with 16 analog inputs and 16 outputs which translate to a maximum of 8 servos as we use them in our lab with an input, an aux and an output channel each. The other 8 channels can be used as physical monitors and servo channels can be assigned to them using the Monitor section of the GUI. Although, performance wise we recommend to only set the number of channels you actually need. As you can see in the picture the GUI was started with only three servo units.

The GUI will create as many components as you need on startup. E.g. if you changed the settings.NUMBER_OF_SERVOS variable it will provide input sections accordingly. If you want to change the number, you’ll have to quit the UI and restart after saving the settings.
Header Section

The header section consists of the device name, display ADwin’s workload and timestamp and provides save and reboot functions. If you provided a save file in your settings_local.py or ~/.nqontrol.py (see section configuration) its name will be displayed in the input field by default.
Saving a device
There are a couple of things we should address when it comes to the perks of saving a device and how it is compatible with an eventual settings file. Here, some things will be overwritten, while others aren’t. What we mean by that is:
a) The number of servos and the number of monitor channels are dictated by the settings file! That means, when you load the UI from a file with fewer servos than previously saved, those will simply be ignored! Make sure to use a different file when you save the new UI state or the old settings will be lost!
b) The device number will only be used from the save if None was given for the ServoDevice deviceNumber.
Servo Section
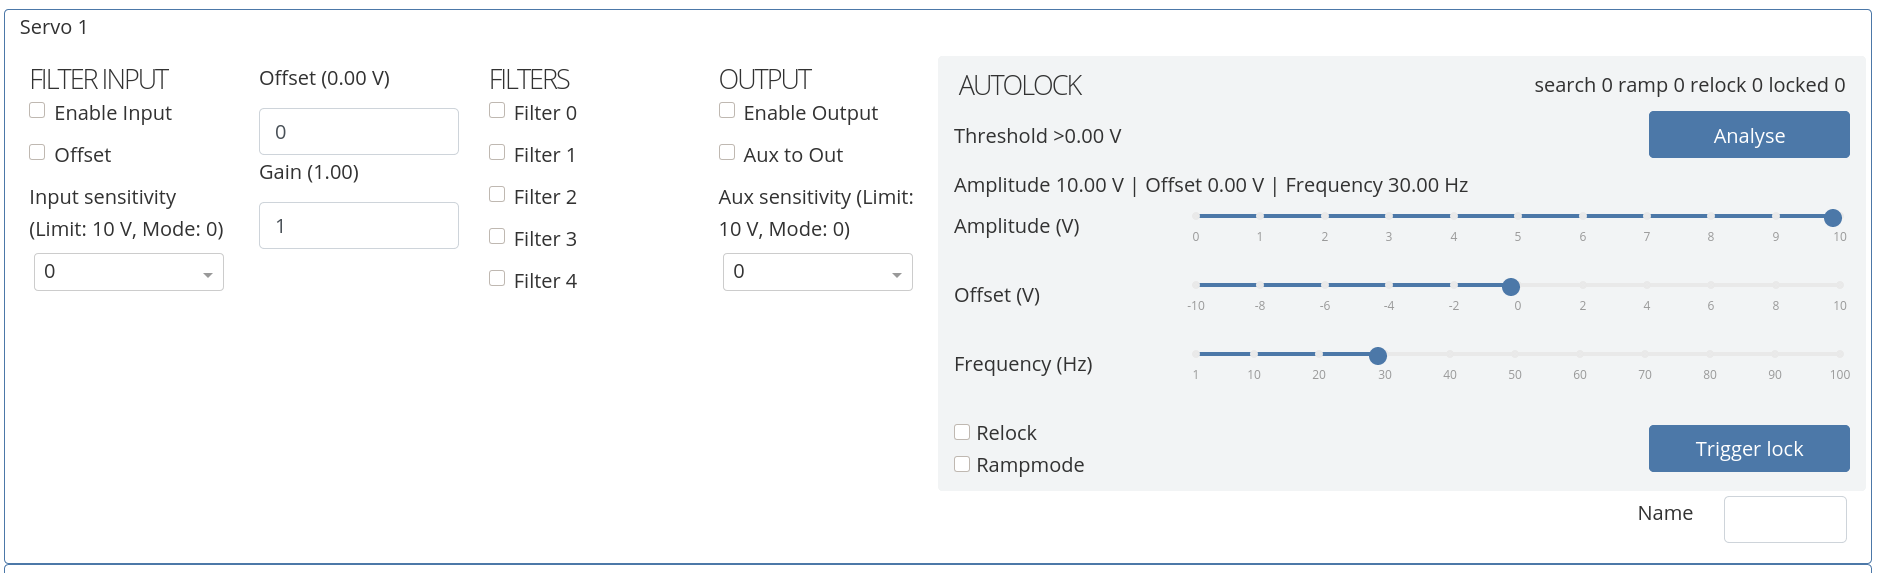
The Servo Section corresponds to the subpackage nqontrol.gui.servo_section and is divided into three parts. The left-hand part is implemented within servoSwitchesWidget.py and the autolock section on the right can be expanded or collapsed to keep the UI clean. It is implemented in nqontrol.gui.servo_section.autolockWidget.py.
The section is modeled after the way ADwin works. So, basically, the input is just the incoming signal. Switch it off and it won’t show in the output. Same goes for the offset, which is applied directly after the input (and the gain after the offset). However, if you don’t turn on the output, you won’t see any of that. If you turn on the aux, the aux signal is added to the output channel AFTER EVERYTHING ELSE.
To understand the Servo unit better, remember the flow chart:

We tried to model the switches section after the chart as best as UI restrictions allowed for. Note that if a lcoking ramp is active on the channel, the output will only show the ramp! Same goes for the autolock during search.
Both offset and gain have to be actively submitted by pressing Enter.
The sensitivity options can be used to get more resolution on your signal. ADwin always sends 16 bit data, so if the signal is only in the -1 to 1 Volt interval you might want to set the input sensitivity to a higher value, e.g. 3 limits the output to 1.25 Volts, while keeping it at 0 would monitor the entire -10 to 10 Volt interval, but uses the same number of bits. This means higher sensitivity means better accuracy bitwise!
Autolock
Within the servo section you’ll also find the autolock section, which looks like this:
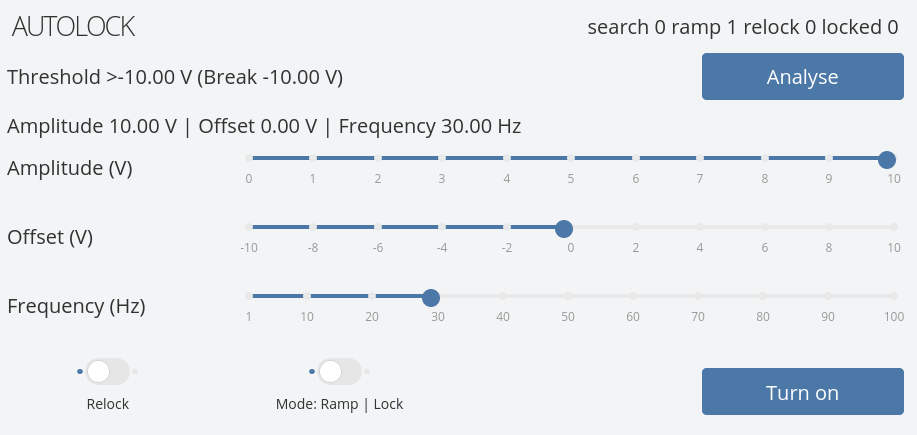
For more information, please read the thorough description here.
Now, let’s shed some light on the Servo Design section and filters.
Servo Design
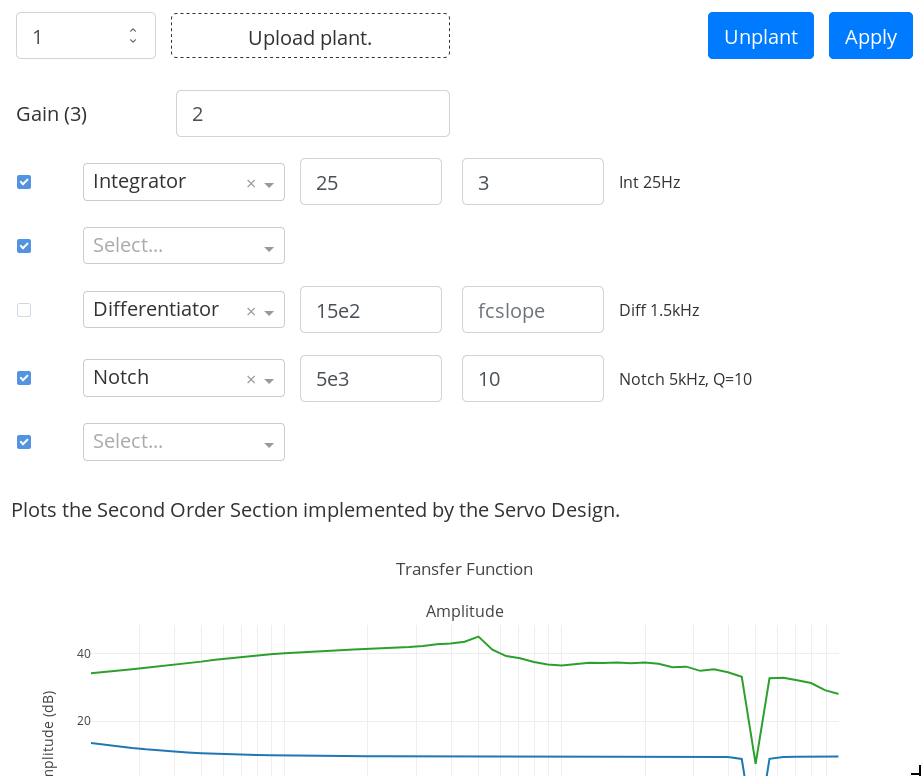
The Servo Design takes a set of filters and transforms them into second order sections which can then be send to ADwin and applied to the INPUT signals.
The numeric input in the top left sets the target channel when applying the Design.
The Gain input has to be actively submitted by pressing Enter.
If you’ve measured a bode plot for the given system you can also upload a plant to work on directly in order to provide a intuition of filter effects.
The widget can be found in the subpackage nqontrol.gui.second_order_section.
Monitor

This widget (nqontrol.gui.monitor_section) has two functions: One is basically a slow oscilloscope and provides some visual feedback on a single servo channel in the UI, the other allows assigning hardware monitors. These can be used to connect a real oscilloscope in parallel with this monitor. The channels here correspond to the physical outputs on the ADwin device, while the dash graph component is just a digital output. The number of available monitors in the UI can be changed in settings_local.py, up to a maximum of 8.