Fitting Measured Beam Data
Extracting waist size and position from measured beam analyzer data is simple. The script expects a data file containing the measurement position (in cm) as first column, and the saggital/tangential beam diameter (\(1/e^2\) value, ie. 13.5%) in µm, as follows:
# position [cm], diameter X [µm], diameter Y [µm]
77.5    939 857
97.5    964 887
107.5   982 954
117.5   1015    1036
132.5   1064    1190
...
With this file, you can then run:
>>> %pylab inline
>>> from nqlab import *
>>> analysis.fit_beam_data('measurement.dat', wavelength=1064e-9)
… to obtain a nice plot:
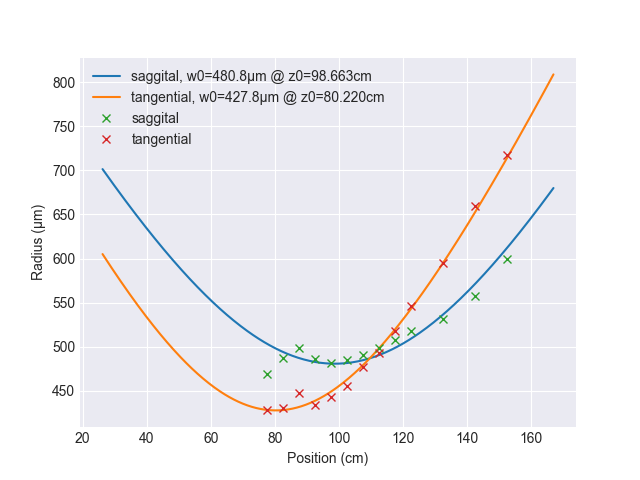
Note
If your file is separated by commas instead of tabs, specify the additional option separator=','. Otherwise, you will get a strange TypeError (“cannot perform __mul__ …”).
For a full list of available options, see nqlab.analysis.gaussian_beam.fit_beam_data().